
Where to Start With Complex Images

Complex images need more than simple alternative text to convey their meaning adequately and can be challenging to make accessible. Examples of complex images include:

  • graphs,
  • charts,
  • maps,
  • diagrams,
  • artwork, etc.

This page outlines general guidelines, but may not be detailed enough for each case. Request a consultation if you need guidance on the best way forward for your content.

Universal Design Goals

The Universal Design Goals below are based on the Electronic Accessibility Rubric. All employees are expected to work toward meeting Universal Design Goals for their content.

  • Include long descriptions in the surrounding text whenever possible.
  • Link to a long description in an appendix if space is lacking on the page. Link back to the original location from the appendix.
  • Many charts and graphs are generated from table data. Provide this table data in addition to the chart or graph. This provides an alternative way for all users to access the information.
  • Provide an accessible table on the same page or as part of a long description in an appendix.
  • Ensure that color alone is not used to convey information.
  • Consider color contrast within images.
  • Ensure sufficient contrast of text within images.

Full Accessibility

Full Accessibility items are necessary to make the content fully accessible. The expectation for employees to work toward full accessibility for their content is dependent on the employee’s role; see the employee responsibilities page for more information. Full Accessibility items may require additional support or alternative access if needed for an accommodation.

  • Check that any interactive images can be manipulated using a keyboard and screen reader.
  • Everything you can do or see with a mouse should be available to both keyboard and screen reader users.
  • If not, add these capabilities or have equal alternatives available.

Offer alternatives for interactive images. Alternatives should share the same information.

Example: Maps

  • The information in maps can often be presented in a list format to provide an equivalent experience to a screen reader user.
  • Include any additional information provided on the map in the lists. For example, campus maps often detail the amenities found in a building. These can be duplicated in a list format.

Alternatives are a short-term solution for many complex images. The goal is to have one version that works for all users instead of having to maintain multiple versions or send some users to another location.

  • Advocate for publishers to make interactive and complex images both keyboard and screen reader accessible.
  • Code interactive images for keyboard and screen reader access if you are the publisher or designer.

Tactile graphics are alternatives that allow individuals to use touch to interpret an image. These can be images on paper that are slightly raised or full 3D models. In each case, different textures are used to convey different areas of the image. This may be appropriate for images that are especially difficult to describe, such as maps or diagrams.

Here is an example of a universally designed way-finding map that includes both visual and tactile information: Tactile map of cultural center in Brisbane, Australia
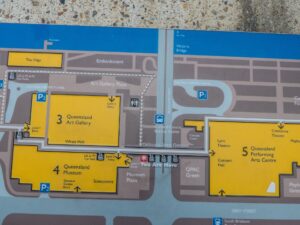
Making tactile graphics can range from the simple (instant raised line drawings) to more complex (requiring design tools and specialized equipment). Which method you use will depend on the need of the individual and the level of permanence desired.

Options for making your own tactile graphics include:

  • Piaf — creates raised lines quickly using heat sensitive paper and a heating element.
  • 3D Printing — tactile graphics are a great use of 3D printing. 3D printing memberships are available at CSU via the Nancy Richardson Design Center 3D lab and the Idea2Product 3D lab
  • Embosser — some embossers are able to produce tactile graphics with Braille labels. This requires specialized equipment and software.

If you’re interested in learning more about tactile graphics, use the contact form to request a consultation.

Applicable Concepts

Alternative text (alt text) is a written alternative to an image. It’s a short description that can be read aloud by screen readers for users with visual impairments.

More about Alternative Text

When images are complex, simple alternative text is not enough. In these cases, long description details everything the audience is expected to get out of the image.

More about Long Description

A table header row is the top row of a table, which acts as a title for the type of information found in each column. It’s important to mark table headers at the code level so the information is structural.

More about Table Header Rows

Color contrast describes how one color stands out from another color. It’s especially important to consider the color contrast between text and its background, and between sections depicting meaning such as pie charts, maps, etc.

More about Color Contrast

For those who are unable to use a mouse, the keyboard is a primary method of navigating a computer (using the Tab, Enter, Arrow, and space bar keys). Other assistive technologies also rely on keyboard accessibility, including voice recognition and screen readers. This is why keyboard navigation is one of the most important things to check.

More about Keyboard Navigation